This is my first post on a series of posts about opvizor. http://www.opvizor.com/ Opvizor is a predictive analysis and issue prevention tool.
In my previous post, Getting Opvizor Working by Michael White worth a read. Michael outlines the install process. I will continue , assuming you have setup the product.
Once we login to the webpage at https://opvizor.com/login/ we see a dashboard. Where to start? That is a lot of information.
In the top left you have the environmental overview. This includes your issues per cluster, host, VM, datastore, and network. As you can see I have induced lots of issues into my lab.
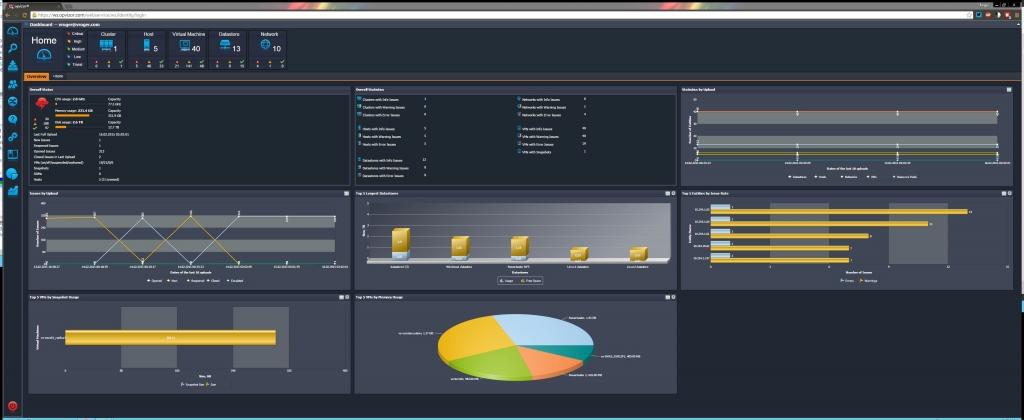
Let’s dig into each.
Overall Status
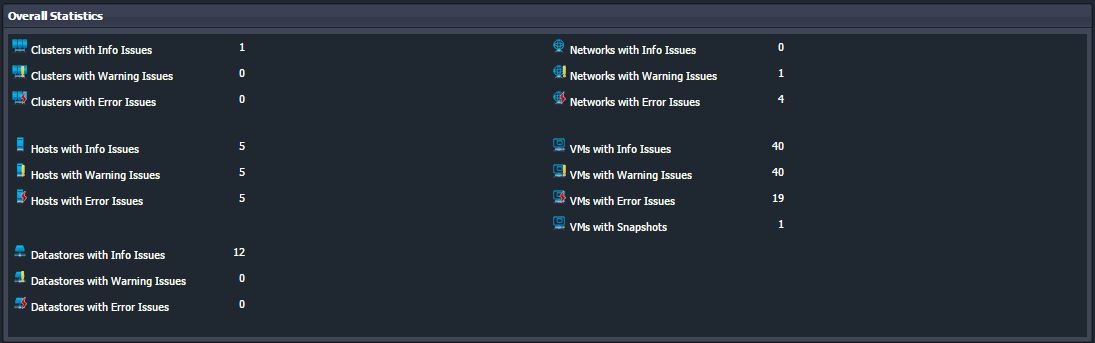
Overall Statistics
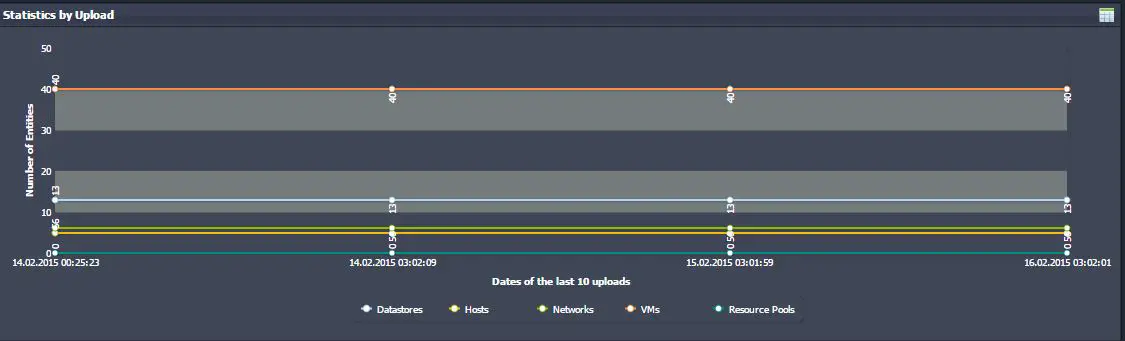
Statistics by Upload
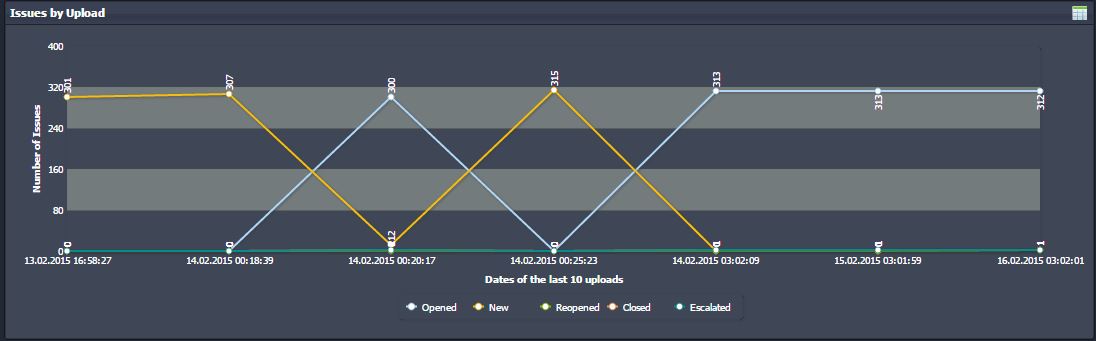
Issues by by Upload
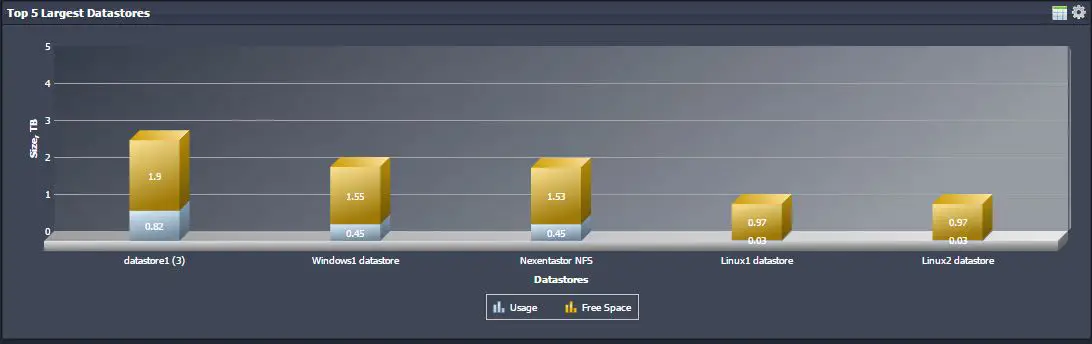
Top 5 Largest Datastores
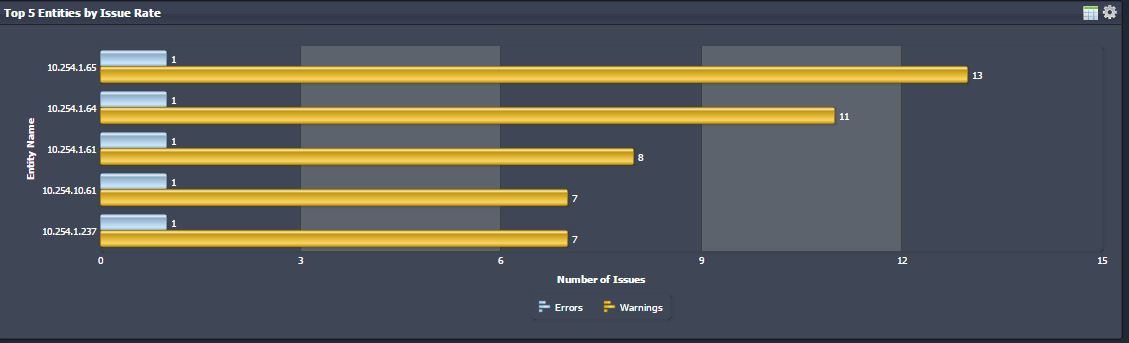
Top 5 Entities by Issue Rate
Top 5 VMs by Snapshot Usage
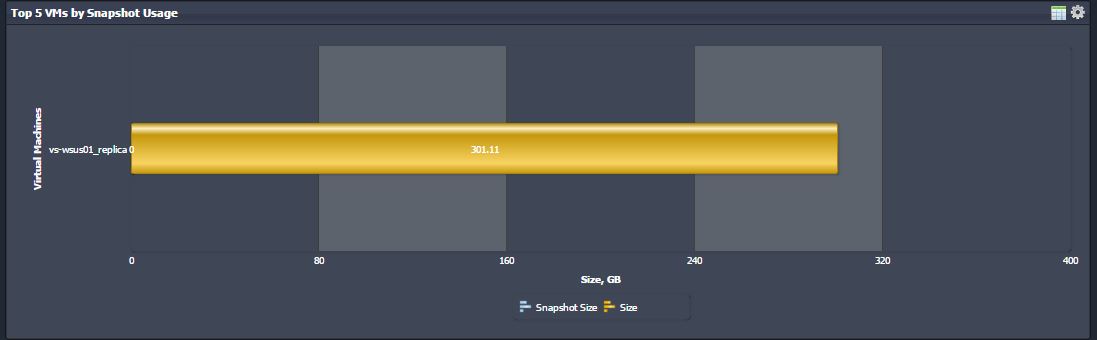
Yikes, that seems a little large doesn’t it?
Top 5 BMs by Memory Usage
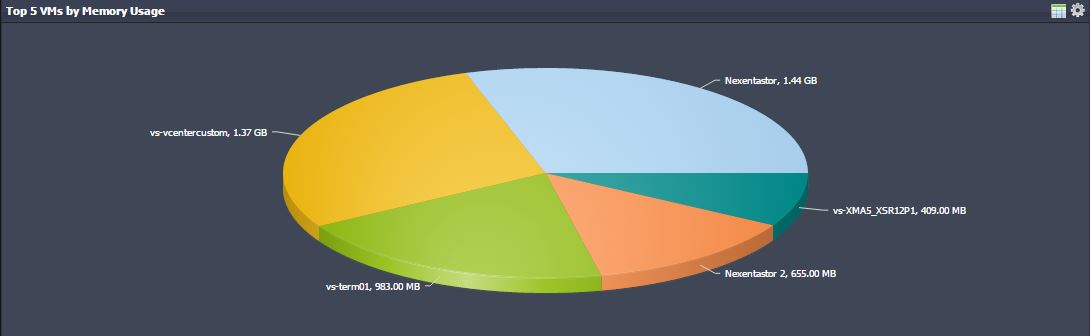
These are fairly self explanatory. But we can dig into each to get more information from this screen.
If we click the small table icon ![]() next to Top 5 Larges Datastores
next to Top 5 Larges Datastores
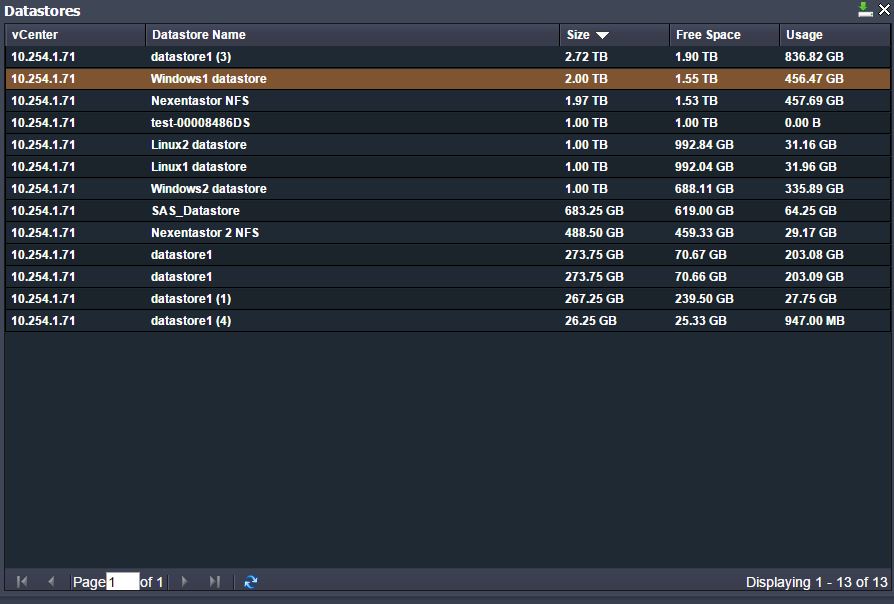
Here we can see more information on the Datastores in my lab.
This is our first look into Opvizor, of the series.
Roger Lund
