Goliath Technologies recently introduced their ChromeOS Device Monitoring and Troubleshooting Solution. They have partnered with Google to be able to provide rich data about the performance and health of ChromeOS and ChromeOS Flex devices. Goliath Technologies is the only monitoring and troubleshooting platform that has access to the Google APIs to get this ChromeOS data.
The Goliath Technologies solution tackles issues using a user experience monitoring model. This model monitors the entire user experience, from the user itself all the way to the application level, including everything in between.
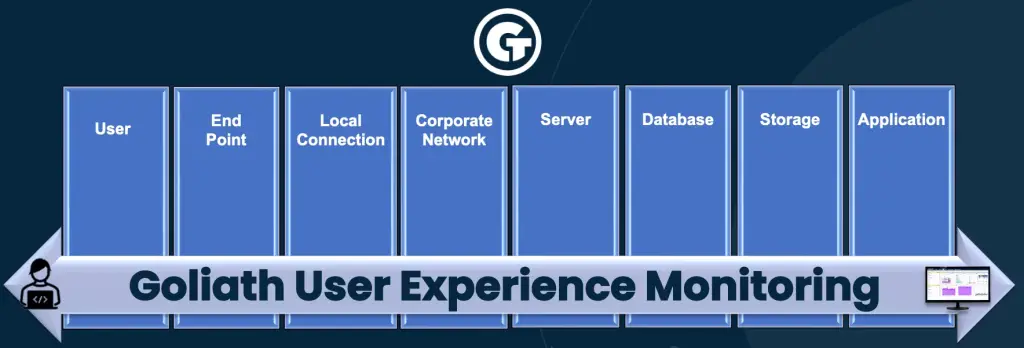
Essentially, this solution is designed to help improve the overall end-user experience. How is this done?
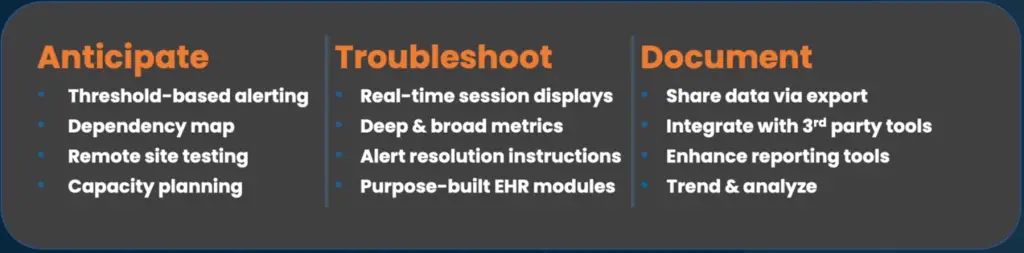
As you can see, the solution leverages embedded intelligence and automation to anticipate issues via alerting, mapping dependencies, remote site testing and capacity planning; being able to troubleshoot and remediate issues using real-time session displays and deep/broad metrics; documenting the entire process by sharing data via export, integrating with 3rd part tools and the ability to trend and analyze.
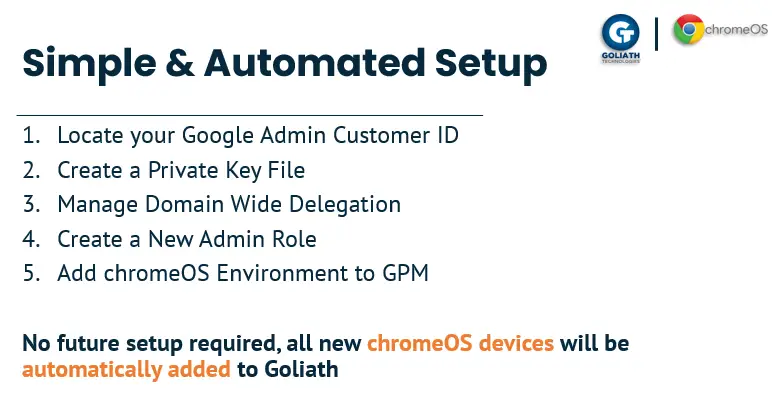
So how do you add your ChromeOS fleet to your Goliath environment? Simple!
Let’s take a look at some screenshots from the solution.
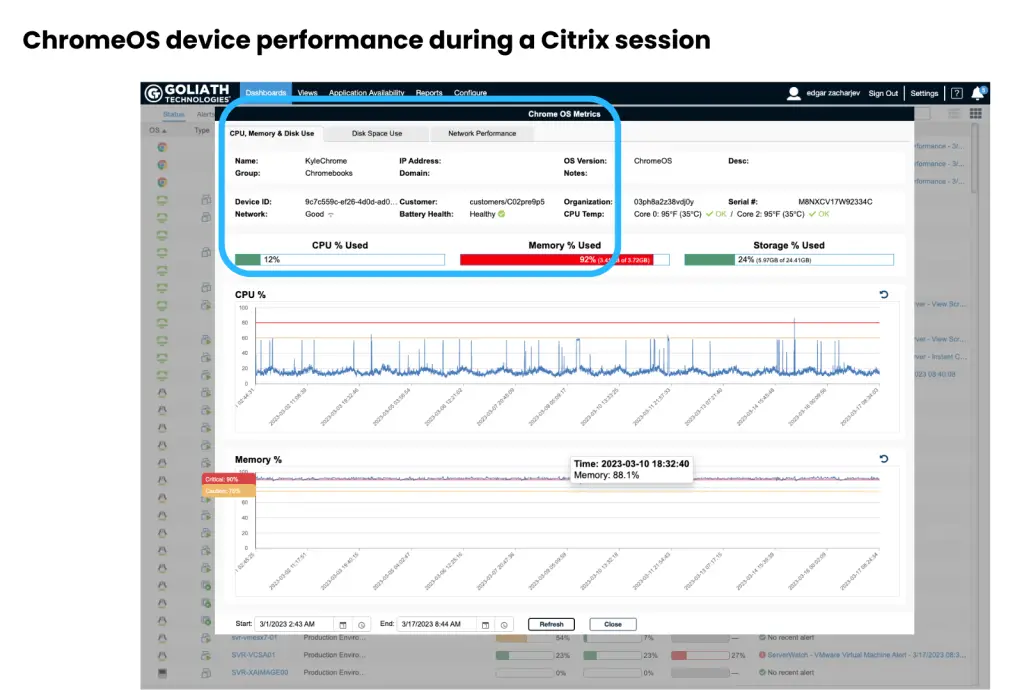
The screenshot above shows you what you will see when looking at a dashboard that shows ChromeOS device performance during a Citrix session. You can select CPU. Memory and Disk Use, disk space use and Network performance metrics using the tabs along the top. In the blue highlighted section, you can see the following information on the ChromeOS device: Name, Group, IP Address, Domain and much more.
Shawn’s take: This is great information when troubleshooting an issue as you can get a quick glance at the state of the device. Often times users will blame the device. This makes it easy to rule out device performance and get to the task of isolating root cause… which Goliath makes quick work of.
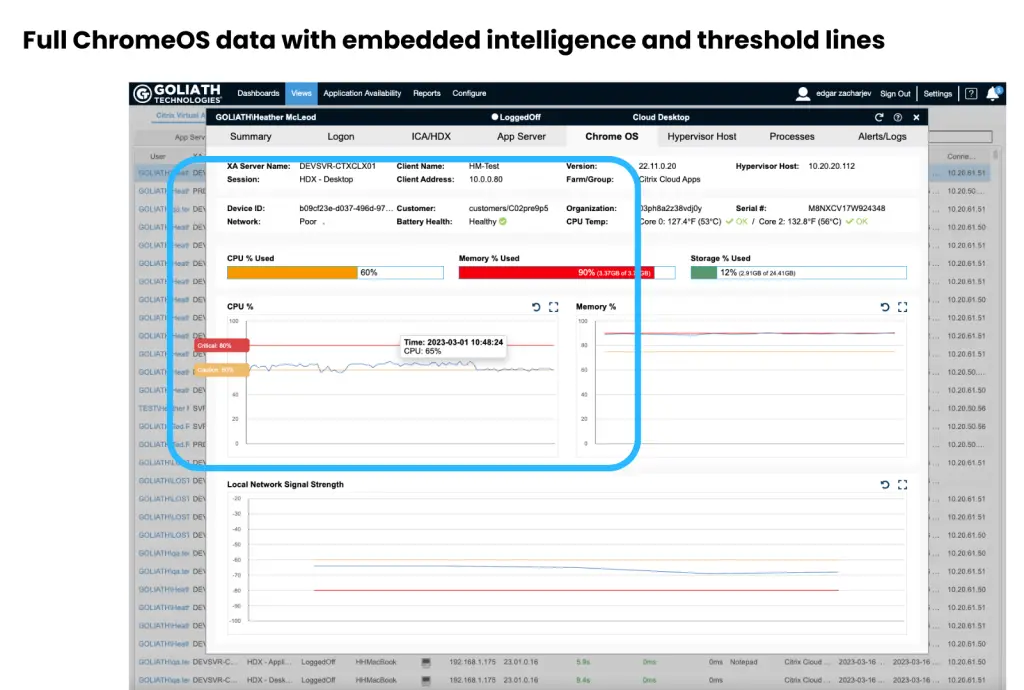
The screenshot shown above is the session view. This particular view is of the ChromeOS tab within the session view. which shows full ChromeOS data with embedded intelligence and threshold lines. This is a view of an entire Citrix session for a user. It is a correlated drilldown of telemetry from all the IT elements that could be impacting end user experience. Only the ChromeOS tab is selected here, but you can view a Summary page, Logon information. ICA/HDX, App Server, Hypervisor Host, Processes and Alerts/Logs. If you highlight any of the chart lines, it will show you the value at different times along the line.
Shawn’s take: If you need to troubleshoot an issue, the more data you can see the better. Views definitely give you a lot of information that an IT administrator can use when working an issue. Goliath takes data to a new level by correlating relevant metrics. This takes the guesswork out of isolating root cause and makes the solution extremely useful for novice support specialists and veteran system administrators alike.
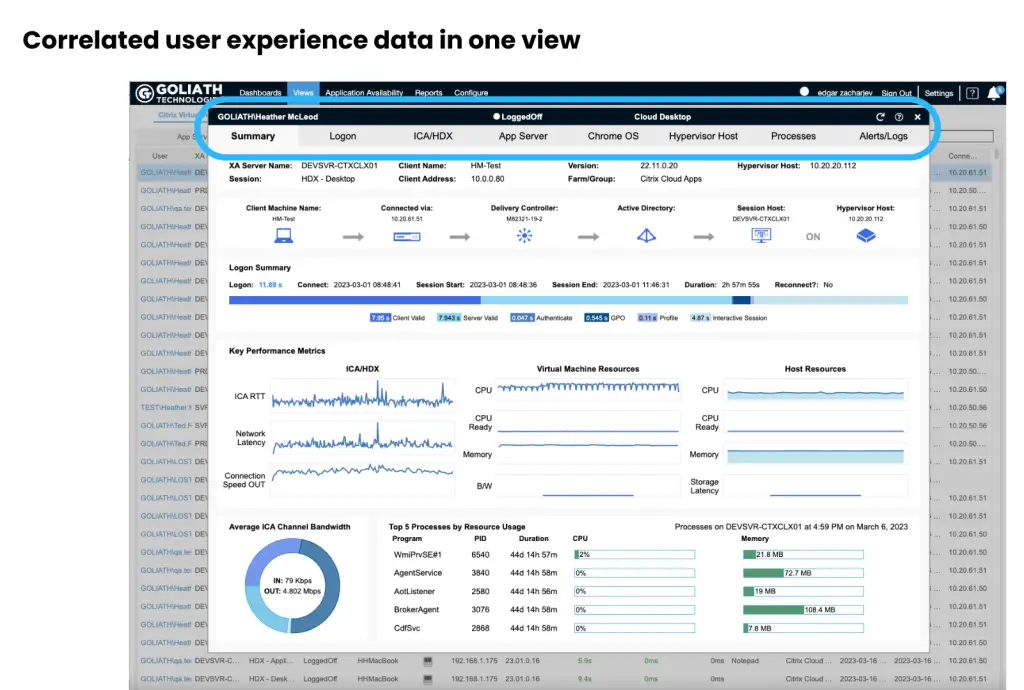
Here is a look at the Summary tab under views. This is a correlated view of all the delivery elements that could potentially impact end user experience. From this view you can get a pretty good idea of where to and where not to look when troubleshooting. With another click, you can get a detailed drilldown into the IT elements that look like they could be causing performance issues.
Shawn’s take: Wow! This is a lot of excellent information. Who knew you could even collect this information and then correlate it with ChromeOS device telemetry? I especially like the flow graphic towards the top, showing each part of the connection. All of this information aggregated into one place is ideal when working to find the cause of an issue.
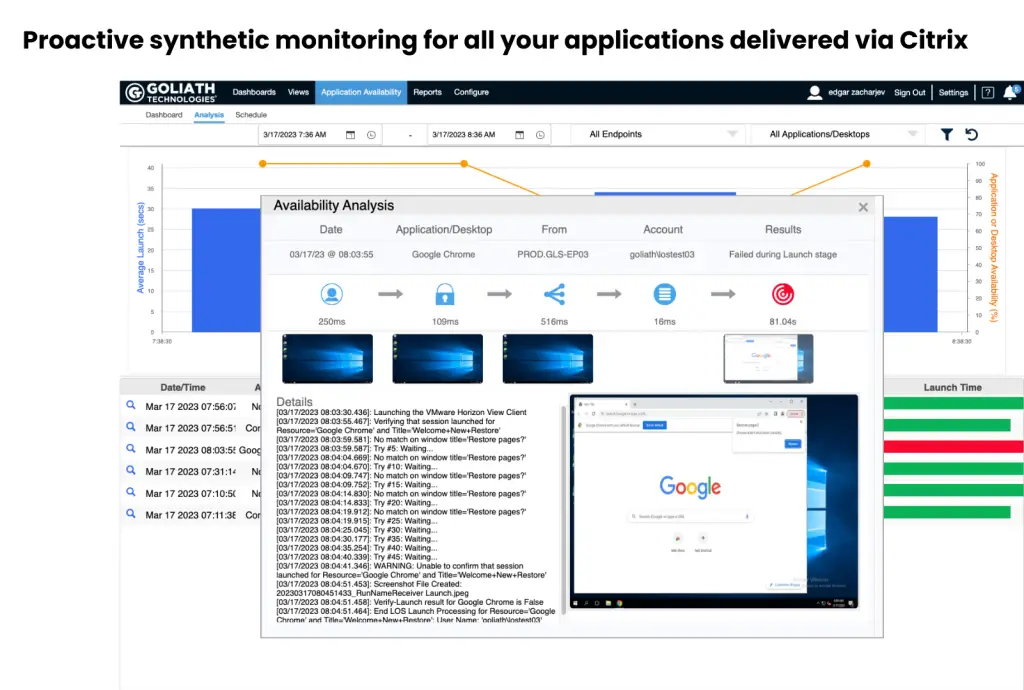
This screenshot shows the Application Availability tab. This section shows you applications that have been launched. This is a set it once and let it run feature. It is a synthetic user logon that continuously 24×7 goes through the entire logon process for monitored applications and then automatically alerts if an application fails to launch. It will then provide a detailed breakdown of exactly what happened in each stage of the logon process and include actual screenshot evidence of the failed launch. IT receives all this and can quickly isolate the root cause and permanently remediate the issue. This means if there is an application failure, most of the time IT can resolve the issue before end users begin to submit tickets.
Shawn’s take: This is an amazing view of information to help figure out why an application may not be available. I never expected screenshots to be available so you can see what the user would have seen. This becomes a powerful way to objectively document both the failure and the remediation.
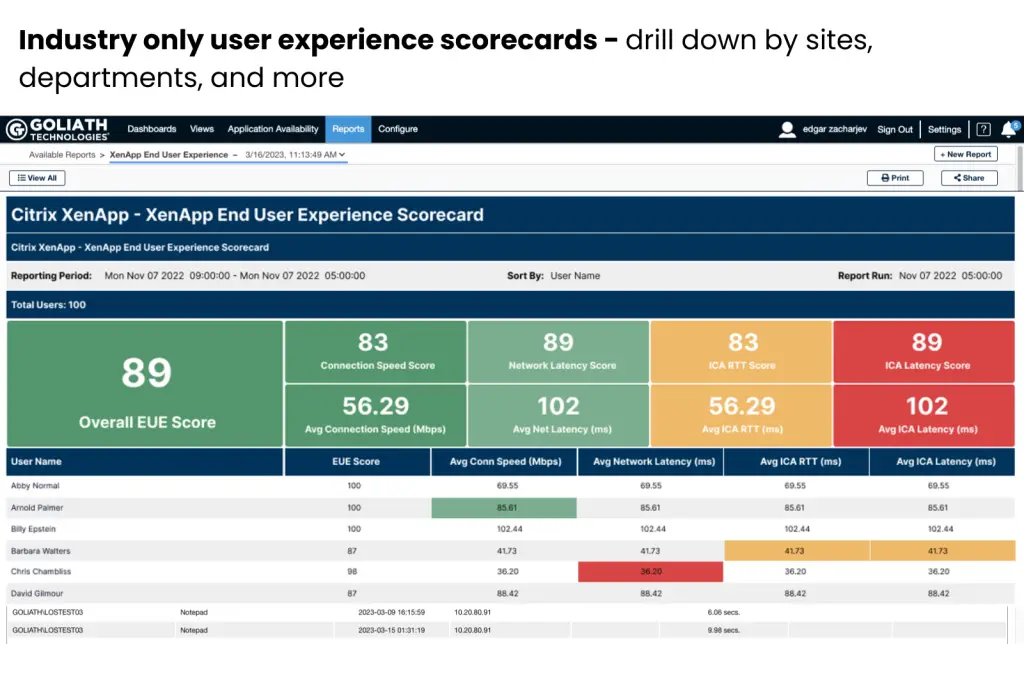
The final screenshot is the End User Experience scorecard, which is found under the Reports tab. This solves three primary challenges for IT; No objective way to prove how well IT is delivering end user experience, lack of necessary data to improve end user experience when there are issues, and the ability to easily determine if issues are widespread or just localized and loud. Add to this the ability to intelligently sort by location or department, and it becomes a powerful tool for IT to leverage for proactive troubleshooting.
Shawn’s take: A scorecard is an excellent way to present the end user’s experience. These scorecards can be used to show what is working well and what needs to be improved on. The colors help you zone in on the potential issues and work to improve on them. This is perfect for executive leadership since they don’t have time to sift through complicated reports or spreadsheets.
Summary
As ChromeOS devices make their way into the enterprise, IT professionals need a way to monitor and troubleshoot these devices and the end-user experience issues. This is exactly what Goliath Technologies ChromeOS Monitoring and Troubleshooting Solution was built to do. It is purpose-built for end user experience, and the addition of ChromeOS / ChromeOS Flex device telemetry makes Goliath an even more powerful tool.
Check out www.Goliathtechnologies.com to learn more about what Goliath can offer your organization and to schedule a free trial or demo.
Additional Resources
Product Homepage: https://goliathtechnologies.com/chromeos/
Request a Demo: https://goliathtechnologies.com/schedule-demo/
Video Introduction: https://player.vimeo.com/video/794266836?h=c819945da9
Customer Success Story: http://bit.ly/3KWrPXB
Disclaimer: This is a sponsored post. Goliath Technlogies compensated me for my time but any opinions given are my own.
