Roger L
Roger Lund
VMworld 2011, Call for Papers, you tell me what you want to see.
I will be attending VMworld 2011 this year, and I am considering submitting a paper, so I can speak. But, I want you to tell me what you want to see. Then what? I’ll write up a blog with top requests, and we can vote. I’ll set a date on the 28th to get the info to me, and the 29th to Vote. Then I’ll have to do some writing…
Let’s get it rolling!
D me on twitter, rogerlund or e-mail me [email protected] , parent of [email protected] and the rest.
Roger L.
EDIT: No feedback, Therefor I will assume no one has any requests that have not been covered, so I will see you at the event!
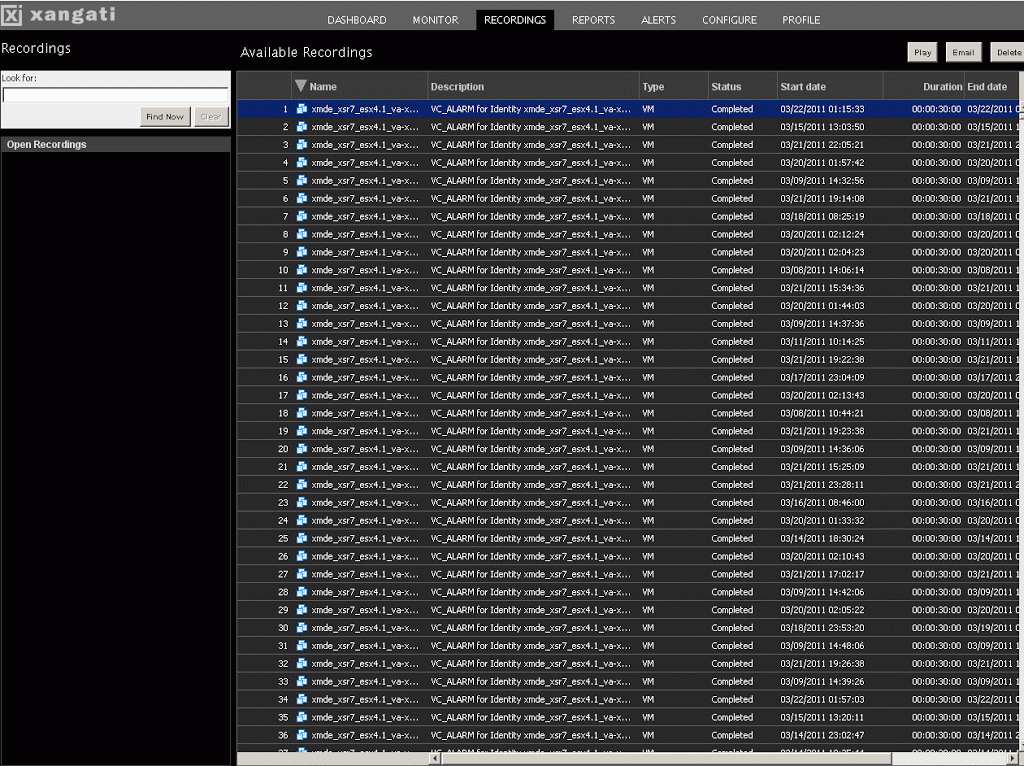
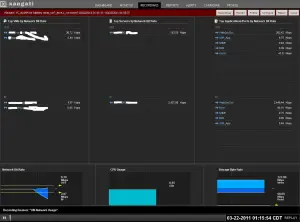
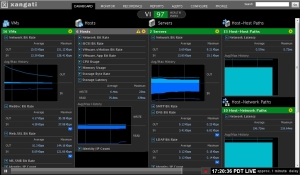
As I stated in my last post, I have a few screens to share of the VI Dashboard. http://xangati.com/products/xangati-vi-dashboard/
This is the Enterprise Dashboard.
Here is a overview of the monitor section. Video!
This is the Auto record section
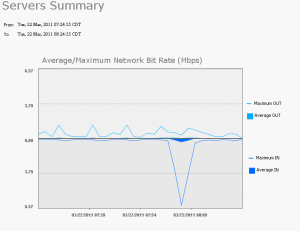
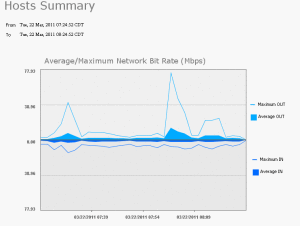
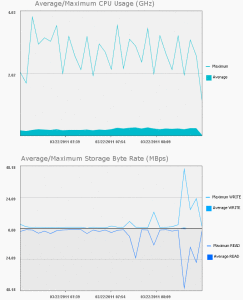
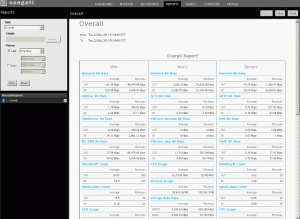
Next are some examples of the reports you can run.
Cool Stuff!
Something like this makes your job easier when monitoring your environment.
Roger L.
Today Xangati released a new release of their Xangati Dashboard.
Cupertino, CA – March 22, 2011 – Xangati, the recognized leader in infrastructure performance
management, today introduced the Xangati VDI Dashboard, the industry’s first solution designed
to comprehensively track all key infrastructure components that affect VDI performance, giving
administrators the confidence and ability to successfully implement large-scale VDI deployments.
Leveraging Xangati’s powerful real-time memory-based analytics engine architecture, the
Xangati VDI Dashboard tracks and continuously monitors activity of all VDI components within
the infrastructure without requiring any agents. The new dashboard also includes a performance
health engine that automatically and visually alerts administrators in real-time about the precise
location of performance issues.
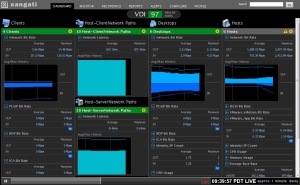
I have had a chance to play with the new Xangati release, and I’ll say that the two new dashboards were an eye opener. I’m going to provide you with a couple boxed screen’s, and dive into more later.
First the VI dashboard, which gives you a customizable dashboard, allowing you to select your VM’s, Hosts, Servers, Host – Host paths, and Host-Network paths to monitor.
The VDI dashboard has a similar layout, only tailored to desktop’s.
Now, this is just the tip of the ice berg, as each dashboard has fancy reports, and monitoring views. I’ll dive into that next.
Here is the text about the new feature release form the Xangati source.
Xangati VDI Dashboard: Breakthrough Features
Real-time Performance Health Engine
The cornerstone of the Xangati VDI Dashboard is its patent-pending performance health engine
that analyzes the health of VDI in an unprecedented four microseconds. Relying on Xangati’s
memory-driven architecture, the performance health of the VDI is being continuously monitored
across a broad spectrum of performance metrics to the unrivaled scale of 250,000 objects (which
can include desktops and clients). In contrast, other performance management architectures are
database-driven and unable to keep apace of dynamic interactions to scale that are fundamental
to VDI.The output of Xangati’s performance health engine is a real-time health index that is linked to the
health of every client, desktop, network link, host, VDI protocol and IT server that can impact VDI
end–user experience. In real-time – as an object’s health shifts – the health index changes toreflect the urgency of the performance issue. Moreover, the performance shift will trigger a real-
time alert, which is uniquely paired with a DVR-recording.The DVR-recording will show exactly where the performance problem stems from and present
contextual insights about what is driving the sub-optimal performance. For instance, a specific
user community is seeing obvious delays in screen presentation due to a high latency network
link. These DVR recordings capture issues that are often outside of a VDI vendor’s software
framework and can be passed to the appropriate IT function, e.g. to the storage team when
storage latency is at the heart of the performance issue.All VDI Operations in a Single Pane of Glass
For the very first time, a VDI team can see in one pane of glass all the critical components that
sustain the VDI, as well as the desktops and their clients. Through this structure, the Xangati
solution is the only purpose-built dashboard framed to replicate how a VDI administrator seeks
to run their operations. Additionally, the VDI dashboard incorporates Xangati’s visual trouble
ticketing model that allows end-users to initiate DVR recordings when they are experiencing
issues. In this manner, the VDI administrator can see, for example, that a user’s poor VDI
experience on an iPAD is due to a highly congested WiFi network.In contrast to other solutions marketed as VDI-focused, the Xangati solution can populate itself
with incredibly rich data without requiring guest software agents. It is this agent-free model that
allows Xangati to be deployed rapidly, even during proof of concept phases, as well as when an
enterprise wishes to scale their virtual desktops into the thousands or tens of thousands.
More information on Xangati : http://xangati.com/VDI_dashboard
http://www.xangati.com
Latest news: From the VMguy http://vmguy.com
Release: VMware View 4.6
I not going to spend much time on this at this point, just want to let everyone know it is out.
“
Some nice new items in this one. If you like, you can proceed straight to the download here. Here’s the what’s new section from the release notes:
VMware View 4.6 includes the following new features:
- Security servers can now accommodate PCoIP connections – Security servers now include a PCoIP Secure Gateway component. The PCoIP Secure Gateway connection offers the following advantages:
- The only remote desktop traffic that can enter the corporate data center is traffic on behalf of a strongly authenticated user.
- Users can access only the desktop resources that they are authorized to access.
- No VPN is required, as long as PCoIP is not blocked by any networking component.
- Security servers with PCoIP support run on Windows Server 2008 R2 and take full advantage of the 64-bit architecture.
- Enhanced USB device compatibility – View 4.6 supports USB redirection for syncing and managing iPhones and iPads with View desktops. This release also includes improvements for using USB scanners, and adds to the list of USB printers that you can use with thin clients. For more information, see the list of View Client resolved issues.
- Keyboard mapping improvements – Many keyboard-related issues have been fixed. For more information, see the list of View Client resolved issues.
- New timeout setting for SSO users – With the single-sign-on (SSO) feature, after users authenticate to View Connection Server, they are automatically logged in to their View desktop operating systems. This new timeout setting allows administrators to limit the number of minutes that the SSO feature is valid for. For example, if an administrator sets the time limit to 10 minutes, then 10 minutes after the user authenticates to View Connection Server, the automatic login ability expires. If the user then walks away from the desktop and it becomes inactive, when the user returns, the user is prompted for login credentials. For more information, see the VMware View Administration documentation.
- VMware View 4.6 includes more than 160 bug fixes – For descriptions of selected resolved issues, see Resolved Issues.
- Experimental support for Microsoft Windows 7 SP1 RC operating systems”
Some nice new items in this one. If you like, you can proceed straight to the download here. Here’s the what’s new section from the release notes:
VMware View 4.6 includes the following new features:
- Security servers can now accommodate PCoIP connections – Security servers now include a PCoIP Secure Gateway component. The PCoIP Secure Gateway connection offers the following advantages:
- The only remote desktop traffic that can enter the corporate data center is traffic on behalf of a strongly authenticated user.
- Users can access only the desktop resources that they are authorized to access.
- No VPN is required, as long as PCoIP is not blocked by any networking component.
- Security servers with PCoIP support run on Windows Server 2008 R2 and take full advantage of the 64-bit architecture.
- Enhanced USB device compatibility – View 4.6 supports USB redirection for syncing and managing iPhones and iPads with View desktops. This release also includes improvements for using USB scanners, and adds to the list of USB printers that you can use with thin clients. For more information, see the list of View Client resolved issues.
- Keyboard mapping improvements – Many keyboard-related issues have been fixed. For more information, see the list of View Client resolved issues.
- New timeout setting for SSO users – With the single-sign-on (SSO) feature, after users authenticate to View Connection Server, they are automatically logged in to their View desktop operating systems. This new timeout setting allows administrators to limit the number of minutes that the SSO feature is valid for. For example, if an administrator sets the time limit to 10 minutes, then 10 minutes after the user authenticates to View Connection Server, the automatic login ability expires. If the user then walks away from the desktop and it becomes inactive, when the user returns, the user is prompted for login credentials. For more information, see the VMware View Administration documentation.
- VMware View 4.6 includes more than 160 bug fixes – For descriptions of selected resolved issues, see Resolved Issues.
- Experimental support for Microsoft Windows 7 SP1 RC operating systems
I recently was challenged with designing a VMware Environment for a team within a existing network.
I had some requirements.
I needed to keep the cost low, meaning I could propose some license costs, but I had to use existing backed storage and server’s with a little ram.
I had ten users that needed to use Visual Studio with dual monitor’s within Windows 7 , but had older computer resources. Staff needed a Environment to that was separated from Production. Staff had a SQL requirement to use in conjunction with Visual Studio in a separated Environment.
I had the following hardware.
A FC San in main Environment.
A VMware View cluster in main Environment
A Hardware Pool with the following.
A Dell MD100 with 14 300GB 10k disk, & PCIe Hardware Raid card.
Two Dell 2950’s.
A Dell 2850.
A Dell 2650.
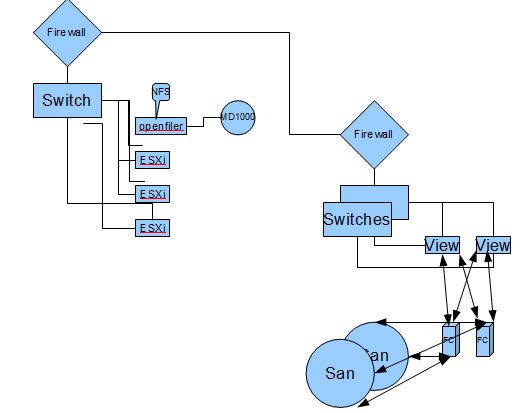
I decided to take the 2850 and make it a openfiler box, connected to the Dell MD1000.
I perposed,the following new hardware for the Lab.
Additional Ram for the three hosts, and the open filer box. I would recommend NFS for ease of use.
A SMB Switch, with enough ports, that has Jumbo Frame and LACP support. The switch had to support the proper VLAN’s for the Lab. NFS, iSCSI, etc.
VMware vSphere, vCenter and Windows Licensing.
No redundant requirements ( IE switch, or storage at this time ) , backup’s were decided to be done outside of this scope.
My Thought process was to take the above hardware and create the needed environment, the challenge was to deliver the VMware View performance and VMware vSphere cluster performance with the above hardware. Additionally, I needed to provide a segmented secure network, with controlled access in and out.
In this first configuration, I recommended a configuration using a firewall both internal to the segmented network, but going into the main Network.
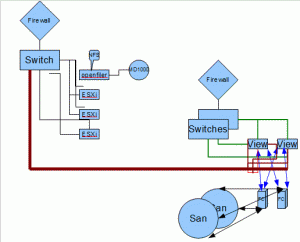
In this configuration I setup two Trunked ports from the Segmented Network, into the VMware View Hosts. This allows the VMware View Desktop’s to be on the Segmented domain.
This would require configuration of Etherchannel on the switches, and a separated vSwitch/vDS that the interfaces would be plugged into on each host. Additionally, a recommendation of using a 1000v Cisco vSwitch with VLAN security, or vShield zones.
Thoughts on each? Other recommendations? Any recommendations to improve each of the above? I’d love to see some comments. Which would you pick, and why?
DM me, or e-mail me.
If you want to see my Prof of Openfiler concept, See my Post:
Lab Powered by vSphere OpenFiler And NFS – A view from Veeam Monitor
Next: backup planning.
UPDATE: To clarify some below questions.
The VMware view host server’s on the right diagram are FC connected to a Enterprise San. the desktop’s will not saturate the San in term’s of I/O.
I also made the recommendation to max the memory on one of the two server’s.
The openfiler box is using raid 10, with 1 hot spare.
A VMware essentials bundle was recommend for in the lab. A cluster will be defined, as two hosts are vmotion compatible.
Roger L
New vBrainstorm Blog Post : A Secure budget VMware LAB Environment – Step one
New vBrainstorm Blog Post : A Secure budget VMware LAB Environment – Step one – Design http://www.vbrainstorm.com/2011/01/secure-budget-vmware-lab-environment.html
Check it out.
Roger L.
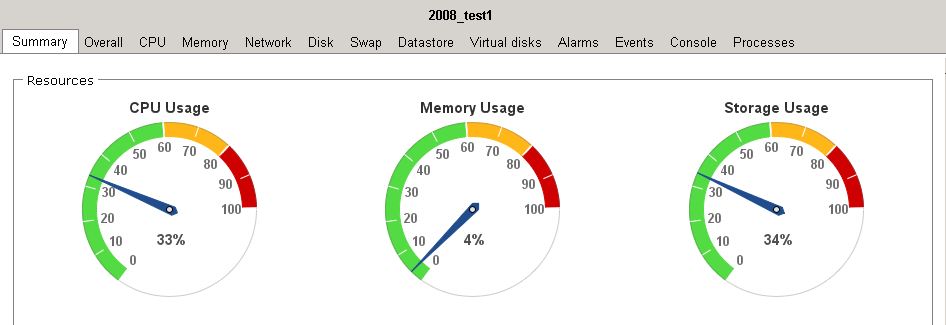
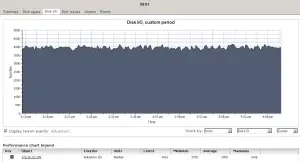
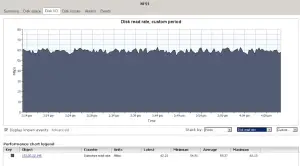
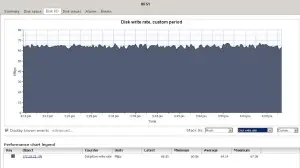
Lab Powered by vSphere OpenFiler And NFS – A view from Veeam Monitor
I have a lab setup that I have been playing with which includes openfiler.
I have a Dell 2950 connected via SCSI to a Dell MD1000 with 14 10k SAS drives ( 1 spare)
A Cisco 3750
And a Dell 2950 running a Server 2008 R2 VM, running IO Meter.
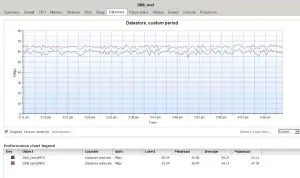
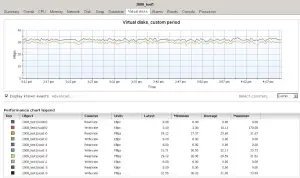
Here are some results.
Settings in IO meter are 32K 100 Read on two drives, and 32K 0 and 0 on the other two.
We’ll discuss design at vbrainstorm.com
Check out Veeam Monitor at www.veeam.com
Roger L
I’ve been extremely busy with the holiday’s and my new job. one of the things on my mind are along the following lines.
Tools, tools and tools. What does one need for VMware Monitoring tools? What tools are needed to cover all aspects of your virtual environment from Test / Dev Lab to View and even to your Main cluster / Clusters. Then assuming you figure how the tools you need, how do you convince and or show management that you or the company needs these tools?
Roger L.
