New press release today! Xangati released a new update to the XMD Suite.
“Cupertino, CA – May 15, 2012 – Xangati, the recognized leader in performance management for virtualization and the cloud, today announced a powerful new release of its Xangati Management Dashboard (XMD) virtualization and cloud suite. The new release of the XMD includes capabilities that give enterprises and cloud service providers a huge advantage in performance assurance for virtualized and cloud infrastructures, delivering: a comprehensive, continuous and high-precision performance management architecture now scalable to the cloud; integrated performance and capacity management in one solution; and the ability to performance profile virtual desktop infrastructure (VDI) end-user activity without agents. The new release of the XMD also allows organizations to quickly uncover cross-silo contention storms with multi-dimensional and linked alert recordings incorporated into Xangati’s flagship Performance Management Engine.
In addition, Xangati simultaneously announced that all of the new XMD functionality is immediately available at absolutely no cost through integration into its VI Dashboard and VDI Dashboard trial software and the Xangati for vSphere—Free single host tool. Administrators can download and use the free two-week trial within a critical cluster or Xangati’s free tool for a single vSphere host for instant insights on what contention storms are within their environment. Xangati’s software has revealed contention storms in more than 90 percent of its deployments.”
Link to full press release.
Source Xangati.
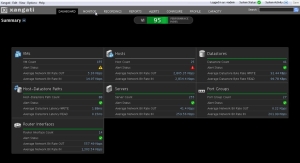
I love the new look of Xangati.
On to the New Features!
“
Now the feature list:
Ø Scale
o Multiple vCenter Support
o Support for up to 32K groups or 250K IDs
o Support for up to 256 Hosts
o Multi vCenter Flow Deduplication
Ø Capacity Management
o Capacity Health Index
o Capacity Alerts
o Capacity Reports
Ø Alerting
o Best Practice Threshold Alerts
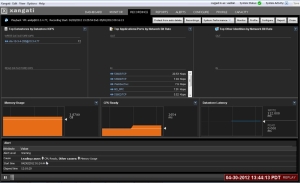
o Linked Alert Replay
o Expanded Alert Aggregation
Ø User Object
o User-Desktop Mapping in VDI Dashboard
o User Monitoring, Alerting, Reporting
Ø Mapping
o Revised VM Naming
Ø VDI/VI Dashboard
o Summary Dashboard View for VI/VDI
o System Activity Popup for VDI/VI Dashboards
o Auto-Addition of Members into View Objects
o Health Index Reporting
Ø General Dashboard
o Consistent Look-and-Feel and Reporting
Ø ROV
o Non-ID VTT Submission
o Health Status for ROV
Ø Access Control
o Windows-based Management User Authentication
Ø Notifications
o SNMP Trap Notifications
o Multi-Mode VTT Notifications
Ø Appliance (System) Functions
o Event-based System Alarm Clearing
o Alert/User/Triggered Recording Space Management”
Source Xangati
Boom, it’s Video Time!
Check out the General Dashboard!
Check out the VDI Dashboard!
I hope you enjoyed the post, make sure to check out Xangati!
Roger L.


