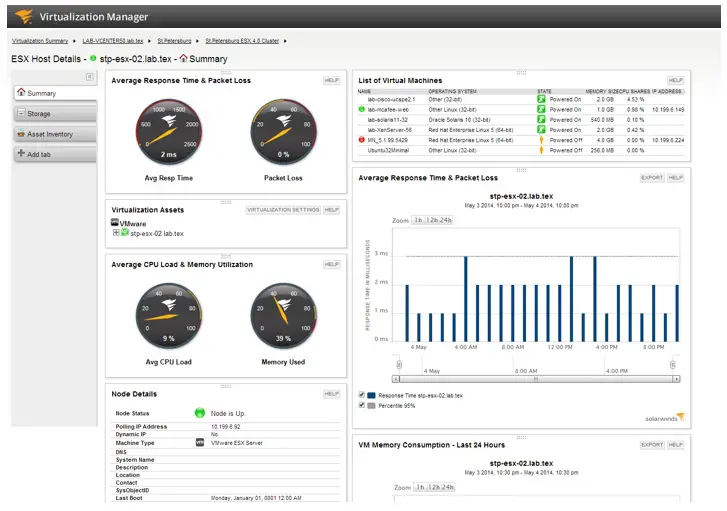
Today, Solarwinds released version 6.1 of Virtualization Manager (VMan) product with a significant focus on bringing together data from VMan and its Server & Application Monitoring (SAM) tool. This means that VMan customers who also run SAM get all the benefits of baselines and deviations alerts for the metrics that VMan is monitoring. The integration between the two systems is also intended to be seamless and easy to configure.
The new version brings the role-based access control, common alerting and reporting and baseline technology from the SAM platform together with VMan. VMan continues to run as its own virtual appliance, collecting and aggregating virtualization data from VMware or Hyper-V, but gives customers the flexibility of viewing and drilling into the data from a single interface within SAM. The number of metrics collected and available from Hyper-V also continues to increase with each release.
I had a chance to speak with Mike Thompson, director of business strategy, and Kevin Miele, director of sale engineering, this week while attending Microsoft TechEd about these enhancements to Virtualization Manager and about general direction that their products are moving in the future. One of the key elements that is shown here and throughout their other products is a stronger integration between individual products and their flagship Orion platform, which SAM runs atop of. The vision is to provide customers with an end-to-end view from the application, to the virtualization platform to the network and storage. VMan is the glue that bridges between the application and infrastructure diagnostics in an increasingly virtualized world. And both Thompson and Miele were quick to point out that integrating SAM and VMan together is extremely simple to do and will not require a lot of custom configuration and tuning.
After plugging VMan into SAM, the system will activate links between the two products, allowing for high level summary down to pinpoint details to find and diagnose performance issues within their applications and systems. Couple that with a third product, Solarwinds Storage Manager, and you expose an additional level of details that you can traverse and locate issues — all within the same familiar SAM interface. And that’s an intentional path that they want customers to be able to diagnose from – starting either at storage and working up or from application and working down. The correlation of data between app and infrastructure and the mapping between them will drive faster diagnosis and triage of problems.
Miele showed me a demonstration of a misbehaving VM running a particular application where we were able to see the malfunction both from an application and a virtualization view and drive down through it deeper to find a root cause for the bad performance, in this case, an overloaded datastore. But, this type of functionality doesn’t require customers to license an entire suite. Each product works well on its own providing value where customers have needs and allowing customers to pick and choose. Since there is some overlap between products, there isn’t a gaping hole in the product if a customer doesn’t choose to license one thing or another. No swiss cheese here.
It has been more than three years since I have taken a serious look at Virtualization Manager. I first discovered and evaluated the product back when it was a startup known as Hyper9. it is great to see how it has developed. I had a chance to reacquaint myself with the product and some of the biggest improvements have to the out-of-box dashboard that come prepackaged. These offer great insight both in summary and to great detail for what’s going on in the virtual environment. Customers can also quickly – and I really mean quickly – build out their own dashboard and the tools to do this are intuitive and easy to use. The metric pickers offer a description of each metric and search so that you can quickly pinpoint which metric you’re looking for when building a new chart, graph and report. When I first evaluated it, most of the interface foxused on a simplified search bar – similar to Google. But one of my complaints then was that you had to know which metric you were searching for and that involved a learning curve. That has been remedied with the Advanced Search window which now lets you search for the metrics and quickly form search strings to get to the data you really care about.
What I find outstanding is that whether you run VMan coupled together with SAM or separately, the depth of information is the same. Some things look more tailored to the SAM interface when viewing from SAM, but the data is the same and offers significant depth.
The Virtualization Manager 6.1 release incorporates performance enhancements that Solarwinds has made to the product based on work that has been done to improve scale with some of its largest customers and environments. Solarwinds has spent a considerable amount of time optimizing and refactoring some of the processes in VMan to meet the needs of one of its largest customers and now all customers will benefit from those improvements.
And, it just so happens that Chris Wahl posted an excellent overview of VMan and the installation process over on WahlNetwork yesterday. You should check that out, too.
